Turn a spreadsheet into a reusable daily revenue dashboard that shows sales, returns, product performance, and day-over-day changes without manual reporting.
New business day: you open your spreadsheet...
Rows everywhere. Numbers everywhere.
But one simple question stays unanswered:
Did my business actually grow today?
That is not analysis. That is busywork - and it is slowing you down.
What if the report were already waiting?
Imagine opening Doc-Vision in the morning and landing on one mini app that already answers the basics:
- How much revenue landed yesterday - gross and net after returns.
- Which products carried the day - without scanning hundreds of rows.
- Whether you moved up or down vs the prior day - without rebuilding pivots.
In short: you stop treating the spreadsheet like the dashboard. You load it once, then let a Daily Revenue Analytics mini app read that dataset and render the answers.
In this walkthrough, we start with a plain order spreadsheet, upload it to Doc-Vision, and use the integrated Claude Code builder to generate the dashboard from a single prompt.
The payoff is how it behaves afterward: AI helps you create the app once. After that, the app is code. When rows change in the dataset, the mini app recomputes from data alone - no repeat prompts, no manual morning tally, no asking the model to redo the math.
The workflow
Here is the flow we will follow:
- Upload a spreadsheet - Doc-Vision detects the columns automatically.
- Open Claude Code and describe the dashboard you want.
- Review the generated mini app.
- Add a new row and watch the app update - no AI needed.
That last step is the point of the whole system. The AI does not become your reporting engine. It builds the reporting engine, and the generated app keeps running as your data changes.
Step 1: Upload the spreadsheet
Head over to the Data Sources app and click Add Data Source. Choose File Dataset.
Doc-Vision can read any financial document - including spreadsheets - through the regular upload flow, where AI extracts and normalizes the content.
For tabular data, use File Dataset - the dataset is stored as a single table that can be queried directly.
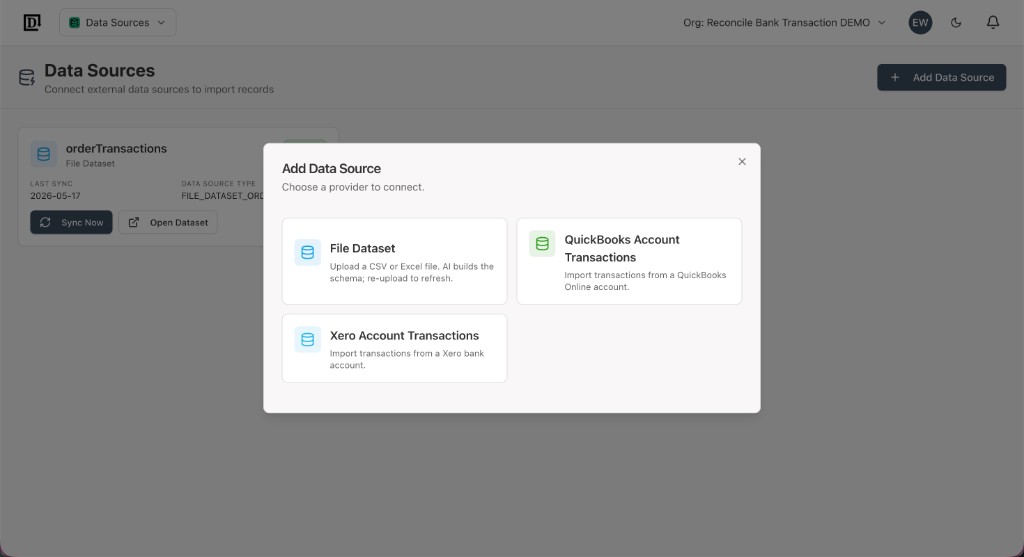
For this demo, the spreadsheet contains order transactions. It has columns like:
- Order ID
- Date
- Product
- Sale Amount
- ...and more.
There is nothing special about the file. It is the kind of spreadsheet a business might already export from a store, CRM, billing tool, or Google Sheet.
When the file is uploaded, Doc-Vision reads the header row, detects the columns, and assigns field types automatically.
This matters because the mini app is not reading a random blob of spreadsheet text. It is querying a structured dataset.
Step 2: Open Claude Code
Next, open the integrated Claude Code builder and create a new mini app.
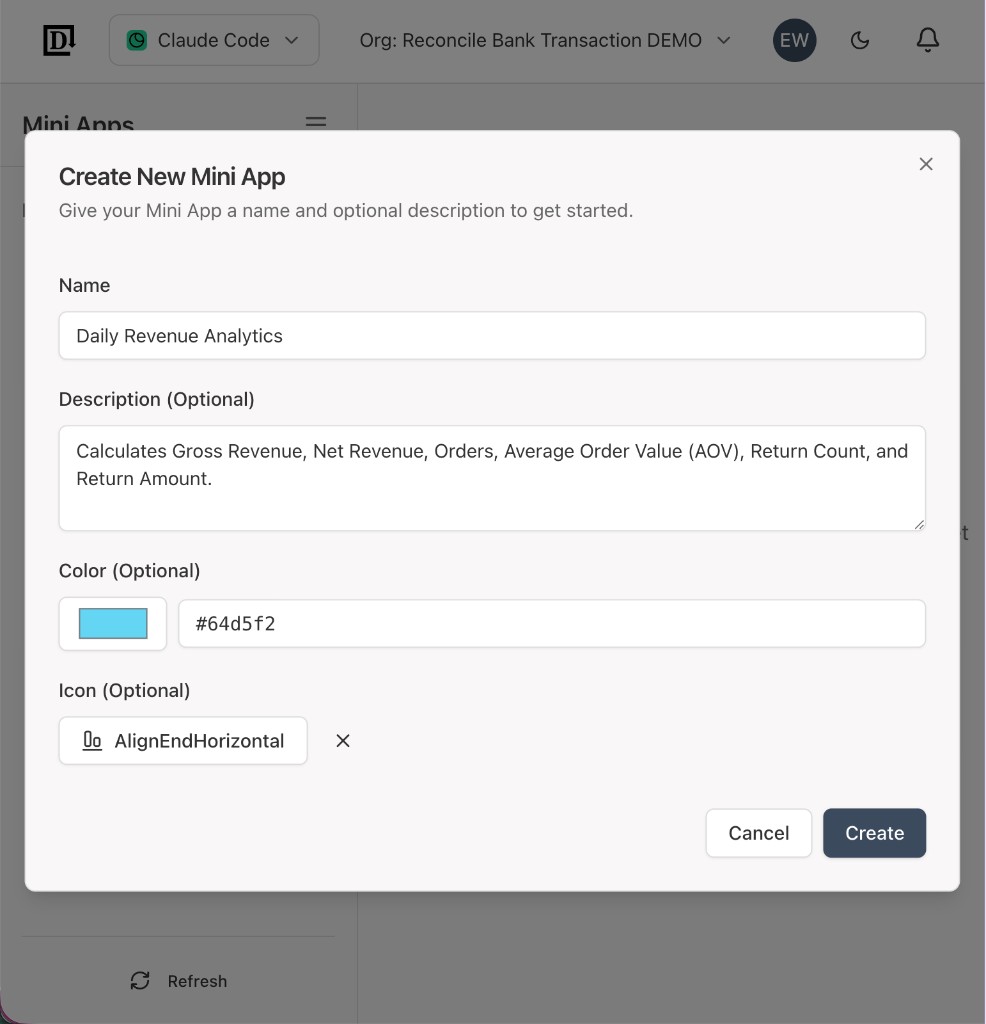
For the name, use:
Daily Revenue AnalyticsYou can also add a description, color, and icon if you like.
Then give Claude Code the full build request:
Build a mini web app for daily revenue analytics.

Goal:
Create a small app where a user can view a daily revenue dashboard comparing yesterday vs the day before.

Core features:
- use the orderTransactions dataset.
- Calculate metrics for yesterday and the day before:
  - Gross revenue
  - Net revenue after returns
  - Total orders, excluding returns
  - Average order value
  - Return count
  - Return amount
  - Product-level revenue and orders
- Display charts:
  - Revenue by product pie chart
  - Orders by product pie chart
  - Revenue comparison by product, yesterday vs day before
  - Orders comparison by product, yesterday vs day before
- Display summary cards above the charts.
- Show warnings if there is no data for yesterday or comparison day.

Tech requirements:
- Store configuration in localStorage.
- Include clean, modern styling.
- Make date handling timezone-safe enough for local browser usage.

Business rules:
- A return row is identified when the configured return column equals the configured return value.
- Return rows should not count as orders.
- Return amounts should be counted separately using the absolute value of the revenue amount.
- Net revenue = gross revenue - return amount.
- Yesterday is the primary report date.
- The day before yesterday is the comparison date.

Deliverables:
- Clear helper functions for parsing, filtering by date, computing metrics, and building chart data.
Notice that the prompt focuses on business rules, not implementation details. We tell Claude Code what the app should calculate, which dataset to use, how to treat returns, and what the user should see.
Claude Code then writes the mini app as real front-end code that runs inside Doc-Vision.
Step 3: Review the generated app
Once the mini app is generated, open the preview.
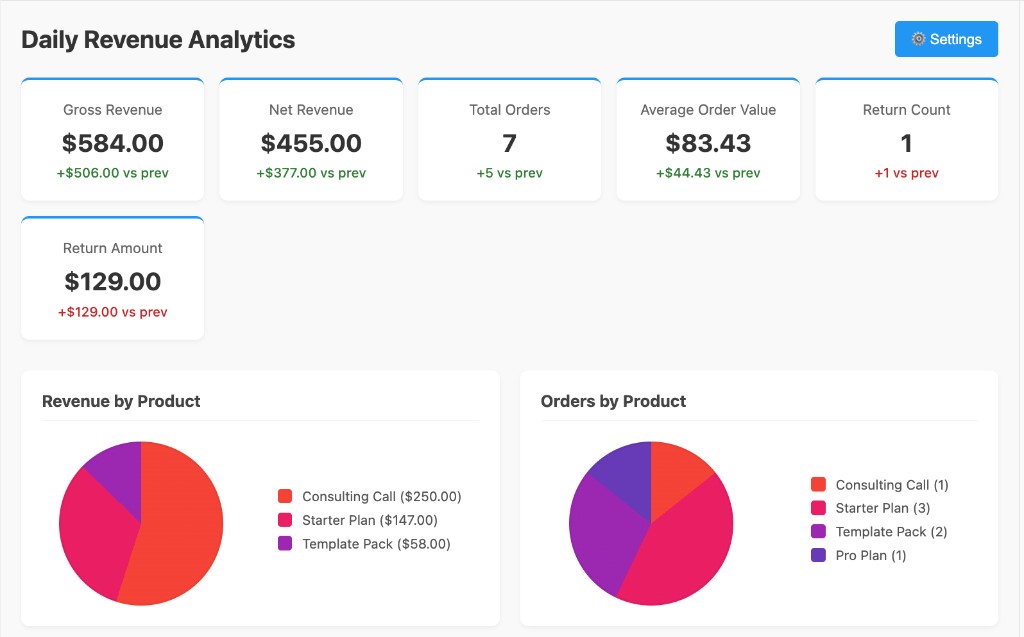
The dashboard now shows the key metrics from the spreadsheet.
Below the summary cards, the app renders product-level charts. You can see revenue by product and orders by product.
Scroll down and the app also compares revenue by product for yesterday versus the day before.
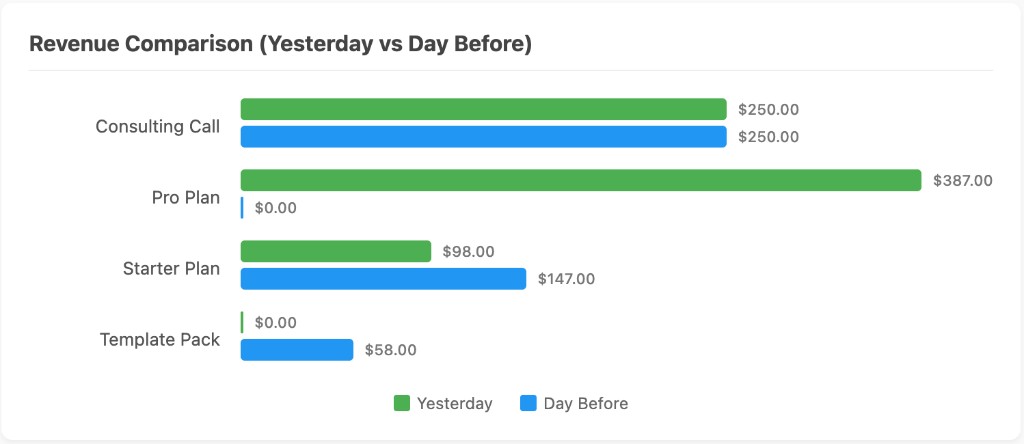
This is where the model has already done its job. It translated the business request into code that knows how to query the dataset, filter dates, handle return rows, compute metrics, and draw charts.
From here on, the mini app behaves like software.
Step 4: Add a new row
Now go back to the dataset and add a new line item.
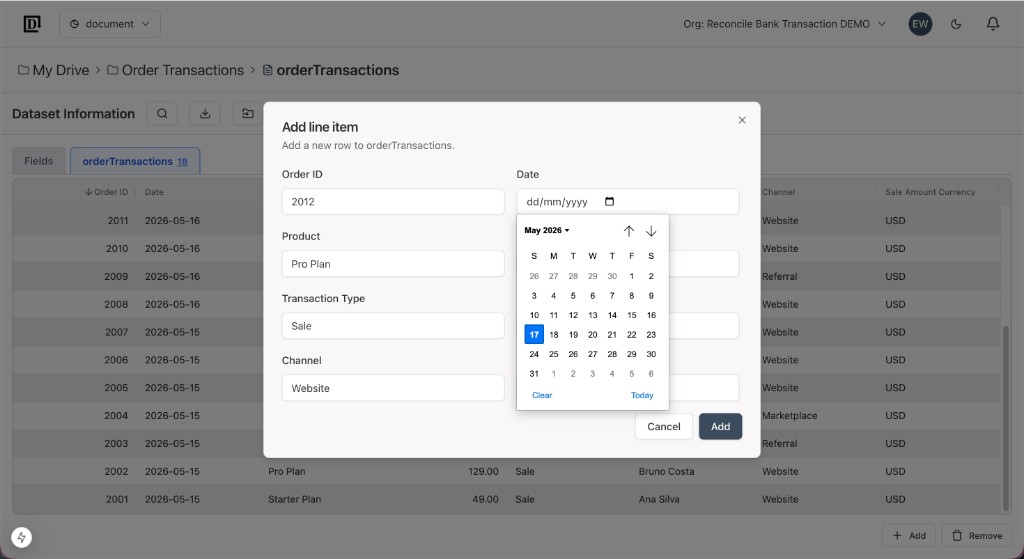
In the dataset, we add another order row.
This is not a new prompt to Claude. It is just a data change. The spreadsheet-backed dataset has one more structured record.
Step 5: Return to the mini app
Open Daily Revenue Analytics again.
The dashboard recalculates from the updated dataset. The summary cards and charts reflect the new row because the mini app is querying the data and running deterministic calculations.
No AI call is needed for this update.
That distinction is important:
- The AI builder is used when you want to create or change the app.
- The generated mini app is used when you want to run the workflow.
- The dataset is the source of truth.
For finance and operations work, this is the safer pattern. Let AI help build the tool, then let code handle repeatable math.
Why this matters
Spreadsheets are flexible, but they are not always the best interface for repeated analysis. Dashboards are easier to read, but they usually require someone to build and maintain them.
The daily report should answer the questions that usually hide inside the rows:
- How much did we make today vs yesterday?
- Which products performed best?
- Which channel or product needs attention?
Doc-Vision's mini app workflow gives you a middle path:
- Upload spreadsheet data into a structured dataset.
- Let Claude Code generate the app.
- Reuse the app every time the data changes.
This is useful for small business owners and finance teams who already track activity in spreadsheets but do not want to rebuild the same report by hand.
You can start with something small like daily revenue analytics, then extend the same idea to reconciliation reports, or any workflow where structured data needs repeatable logic.
You can even connect Doc-Vision directly to your bank account, QuickBooks, or Xero to get the transaction data automatically.
The end result is not just a chart. It is a custom, reusable business tool built from your own data - shaped around your columns, your business rules, and your workflow.
A few questions that usually come up
"I am not technical - can I still do this?"
Yes. The only thing you write is a plain-language prompt describing what you want. Claude Code handles the code. If the result is not quite right, you just prompt again and it adjusts.
"My spreadsheet looks different from the demo."
That is fine. Doc-Vision reads the header row and infers the column names and types from your actual file. The prompt you give Claude Code describes the logic - you just reference your own column names instead of the ones in this demo.
"What if something in the app breaks or needs changing?"
Open Claude Code, describe what needs to change, and let it fix or update the app. You do not need to touch the code directly.
"Is my data safe?"
Everything stays inside your Doc-Vision organization. The mini app reads data from your own dataset - nothing is sent to any external server.
"Can I share the mini app with others on my team?"
Yes. Any mini app you build is available to everyone in your organization, so the whole team can open the same dashboard without each person having to set it up themselves.